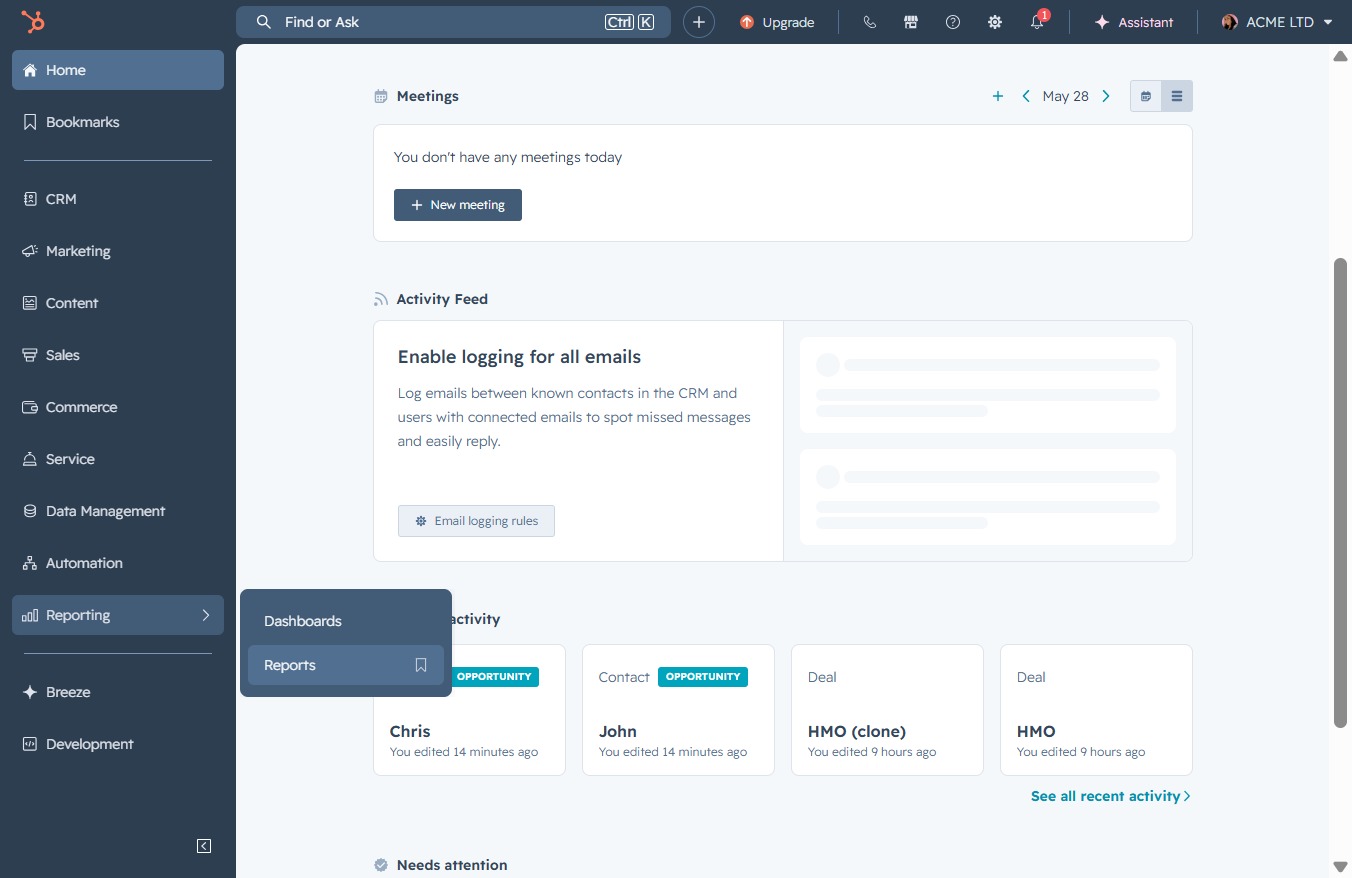
Click the Reporting section
This action will take you to the Reporting section where you can view and analyze various performance metrics and data related to your activities.

Loading screenshot…
100%
Generate a deal age report in the reporting section to analyze closure times and sales trends by customizing the report settings and access permissions as needed.
 viktoria
Generate a deal age report in the reporting section to analyze closure times and sales trends by customizing the report settings and access permissions as needed.
This action will take you to the Reporting section where you can view and analyze various performance metrics and data related to your activities.
Selecting the Reports link takes you to the reporting section where you can view and analyze various performance metrics and data insights.
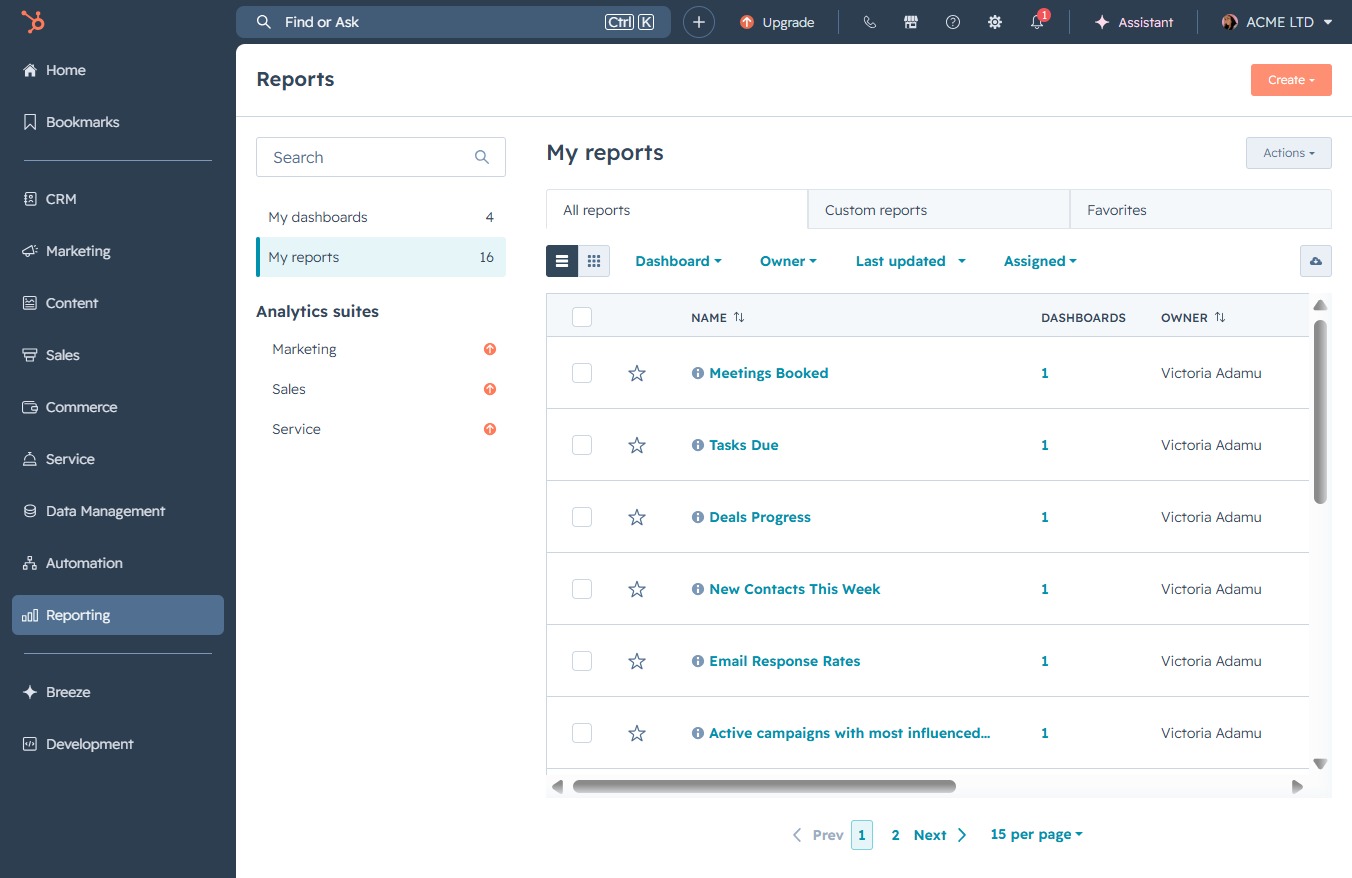
Clicking this button will initiate the process to create a new report within the 'My Reports' section.
This action initiates the process of generating a new report, allowing you to customize its parameters and content.

This action activates the search input, allowing you to filter and find specific templates quickly.
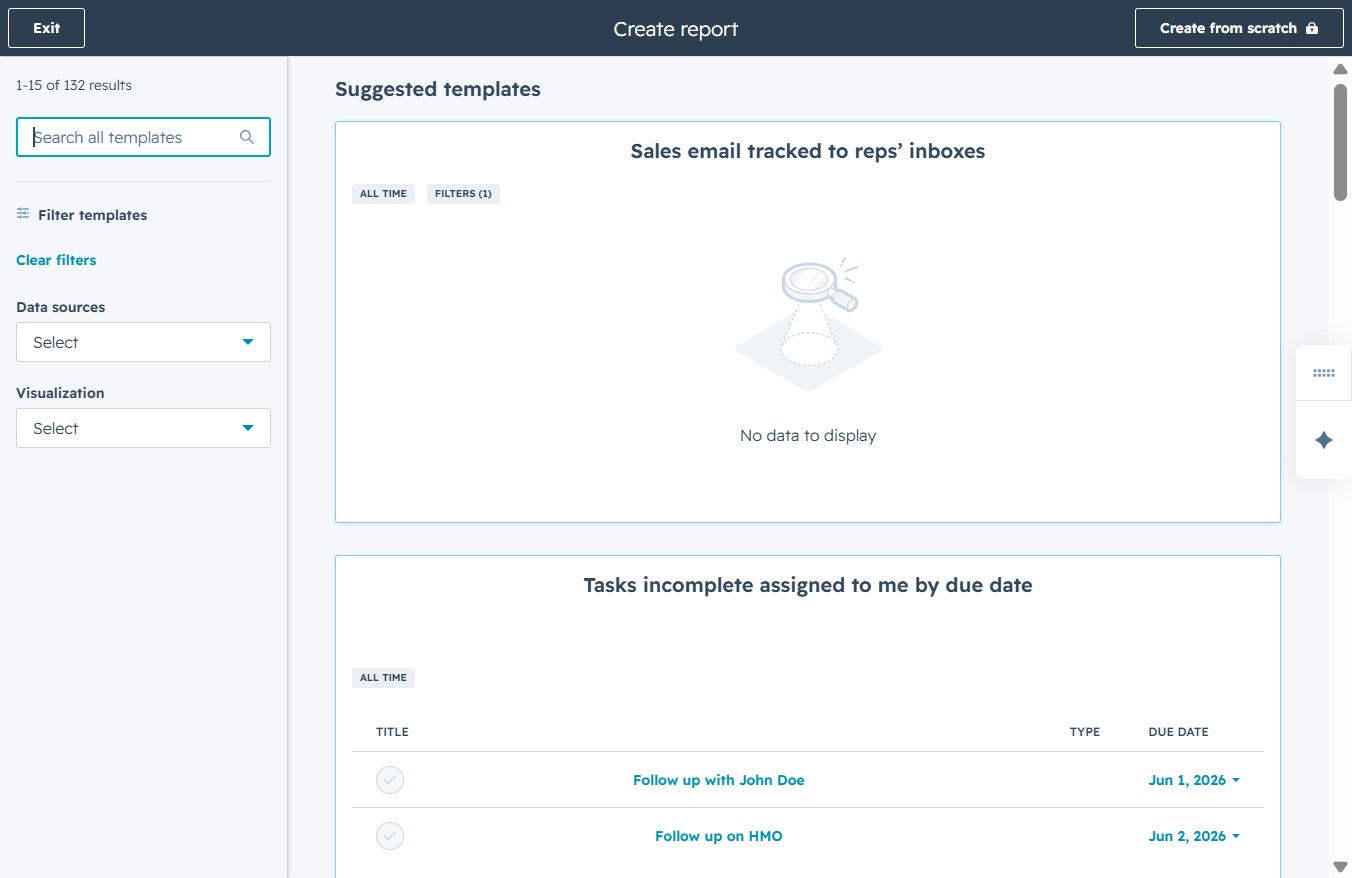
Entering 'deal age' will initiate a search for templates related to deal age metrics, allowing you to see relevant reports and insights.
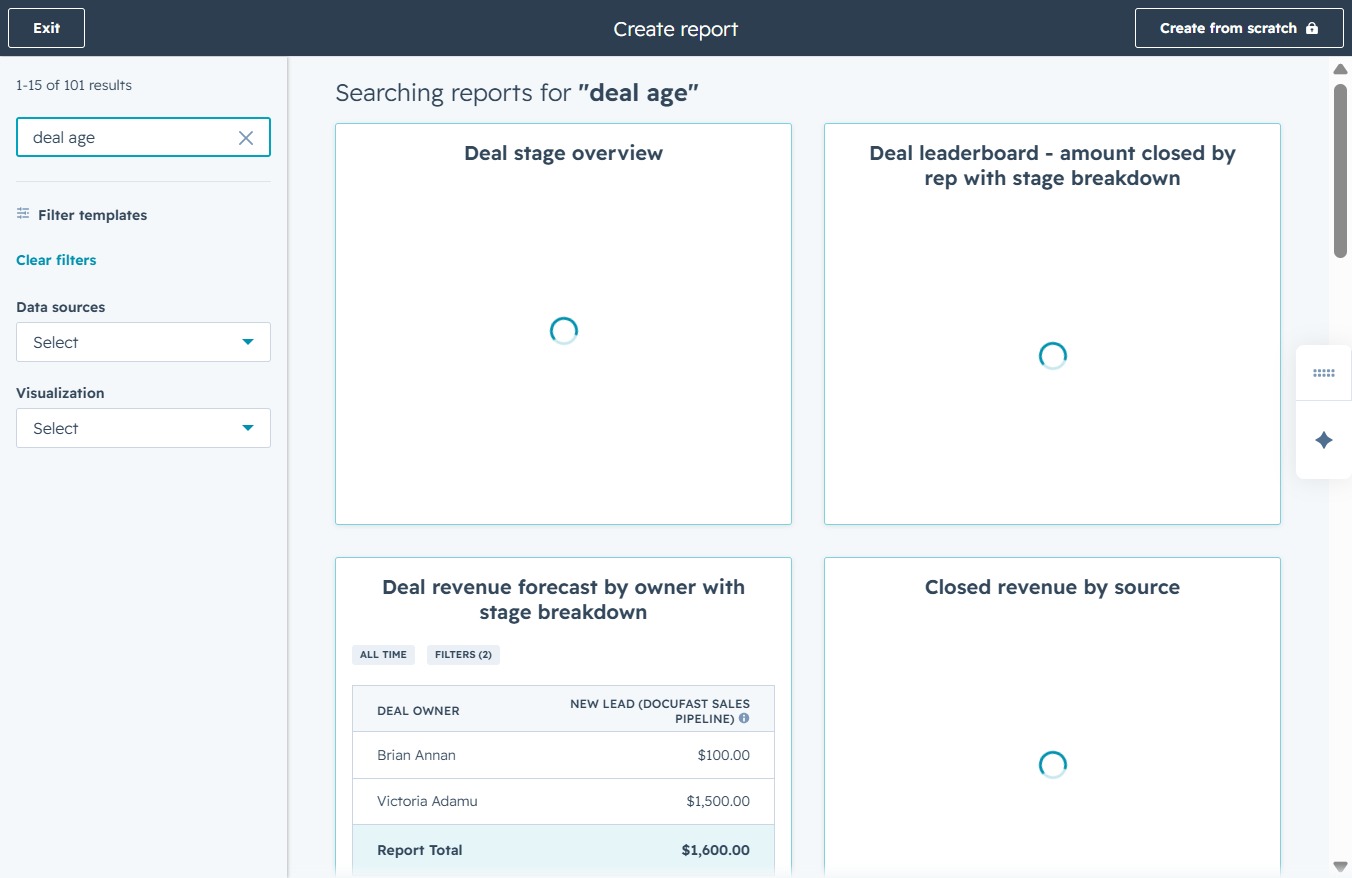
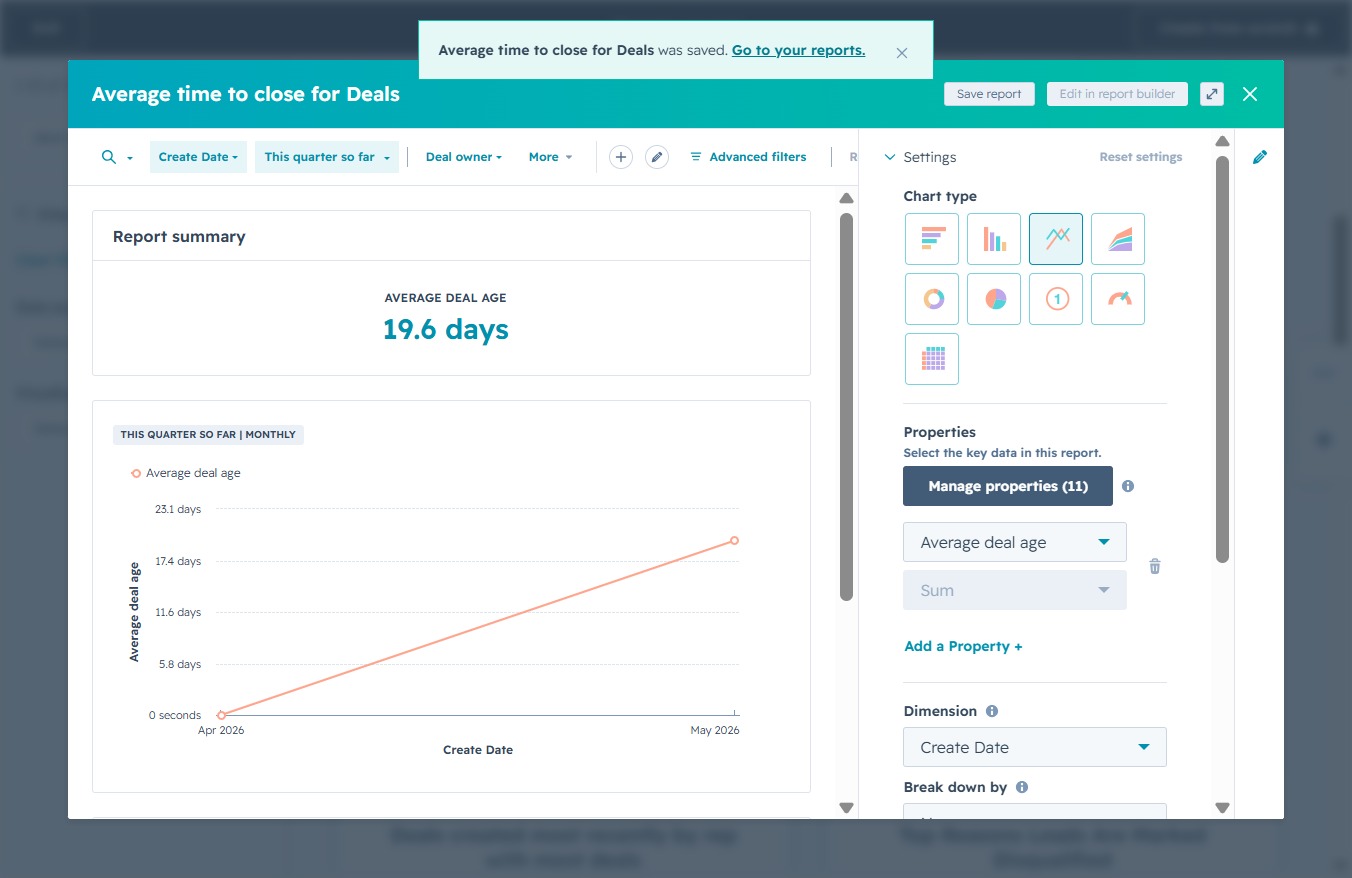
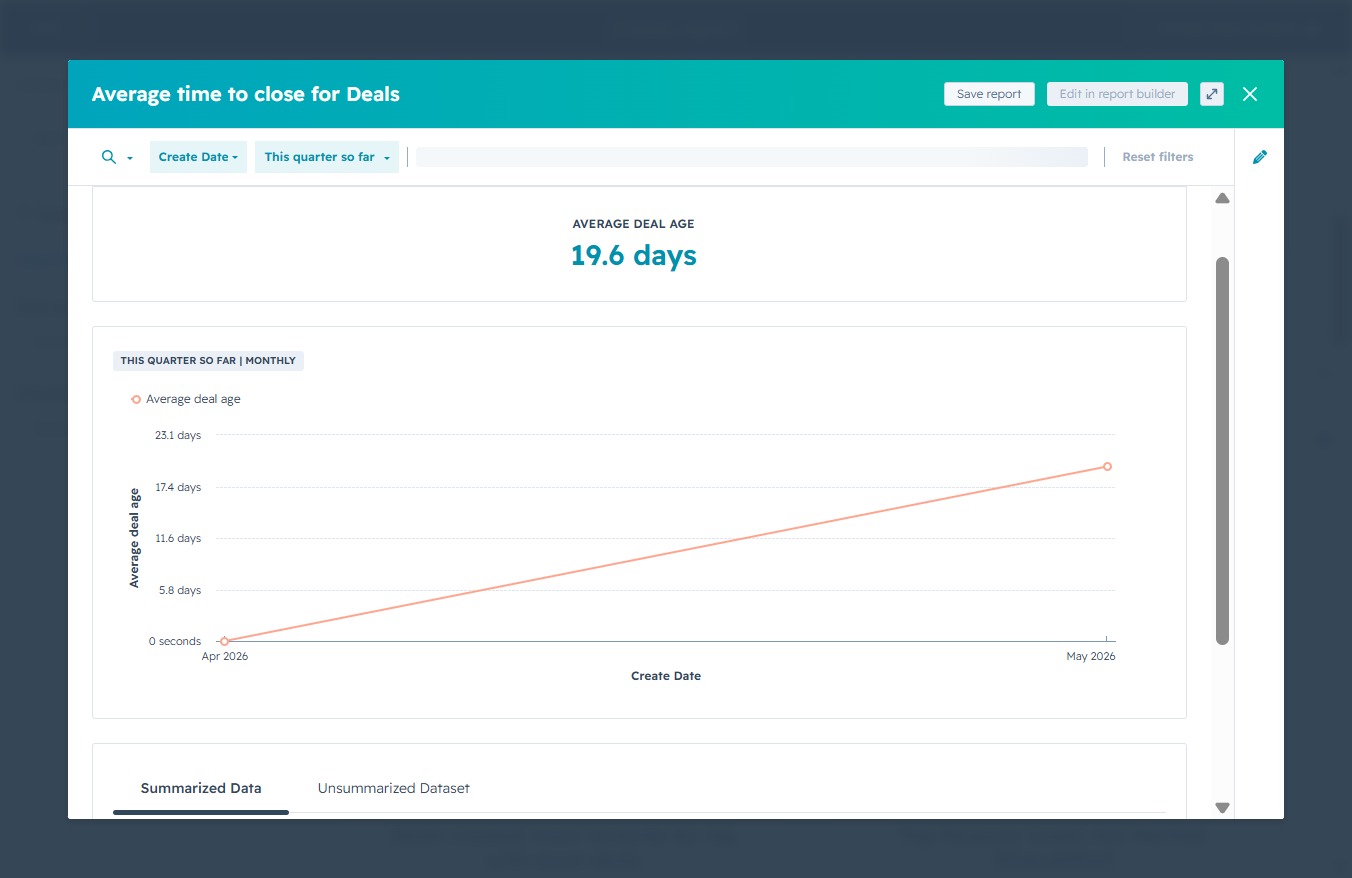
By clicking the Average time to close for Deals chart, you'll access a visual representation of deals' closure times for the current quarter, allowing you to analyze trends in your sales process.

Clicking the 'Save report' button will save your current report settings, including the average deal age data and any customizations you have applied.
Clicking 'Next' will proceed to the next step of saving your report, allowing you to continue customizing it for your dashboard preferences.

This action will save your report along with the selected access settings for who can view or edit it. Ensure you've chosen the appropriate access level before saving.

This action will save your report with the current settings and access permissions you configured. Ensure that all desired options are selected before proceeding.

This action takes you to the reports section, where you can view and analyze various metrics related to your deals.