Click the Dashboards section
This action opens the Dashboards view, allowing you to access and visualize data reports and metrics essential for performance tracking.

Loading screenshot…
100%
Update your HubSpot reports to reflect daily and weekly sales trends, enabling you to visualize performance metrics, track lead progress, and analyze traffic sources effectively.
 viktoria
Update your HubSpot reports to reflect daily and weekly sales trends, enabling you to visualize performance metrics, track lead progress, and analyze traffic sources effectively.
This action opens the Dashboards view, allowing you to access and visualize data reports and metrics essential for performance tracking.
This will open the dashboard for analyzing campaign performance metrics, including active campaigns and email response rates.

This action will open the Sales Overview dashboard, providing insights into sales performance metrics and trends.

This action opens the details for the 'New Lead' stage in the DocuFast Sales Pipeline, allowing you to view insights and metrics related to the count of deals in that stage.
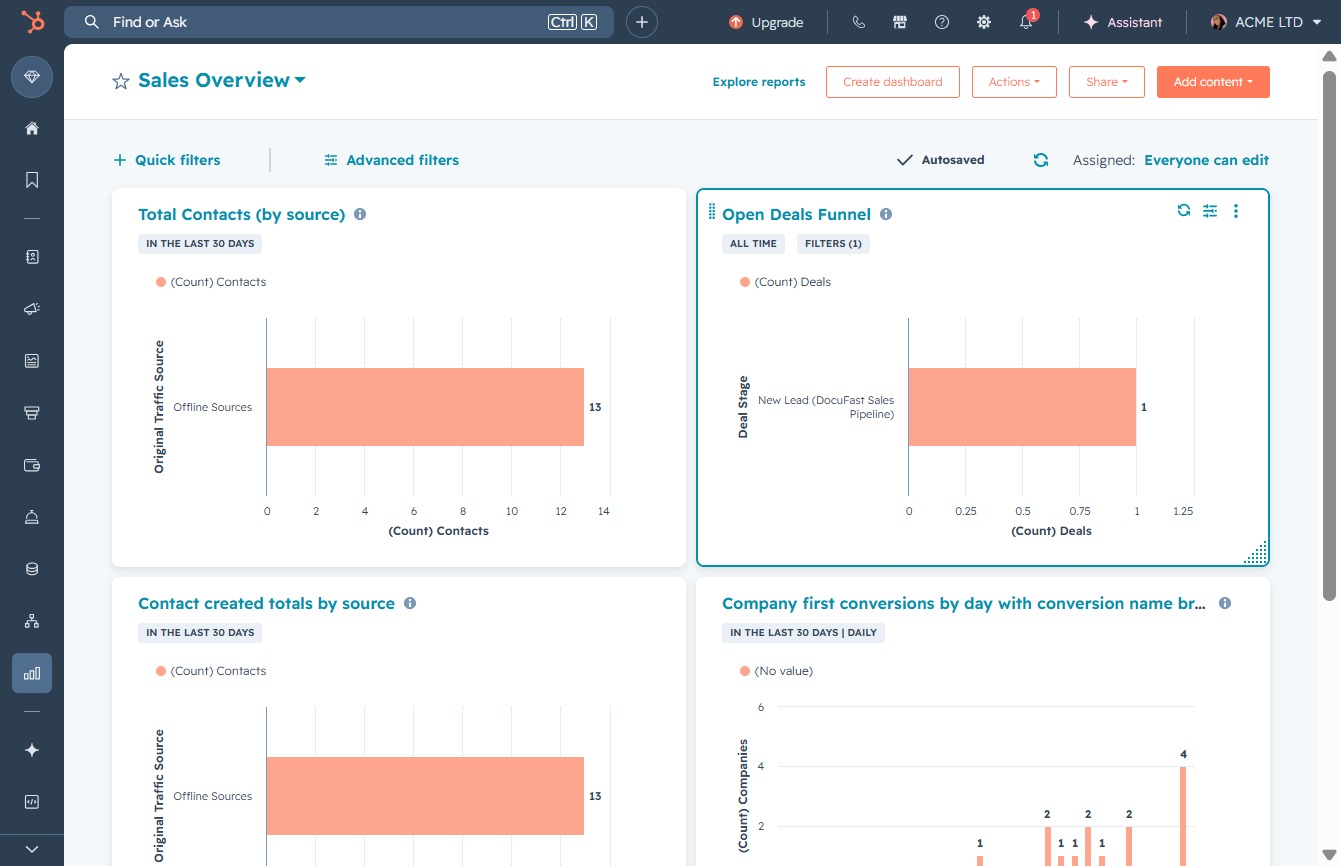
This action will display the data visualization of contacts generated in the last 30 days, categorized by their original traffic sources, allowing you to analyze trends in contact acquisition.

This action displays the bar chart representing the count of deals for different stages in the sales funnel. You can analyze the performance of deals across various stages at a glance.

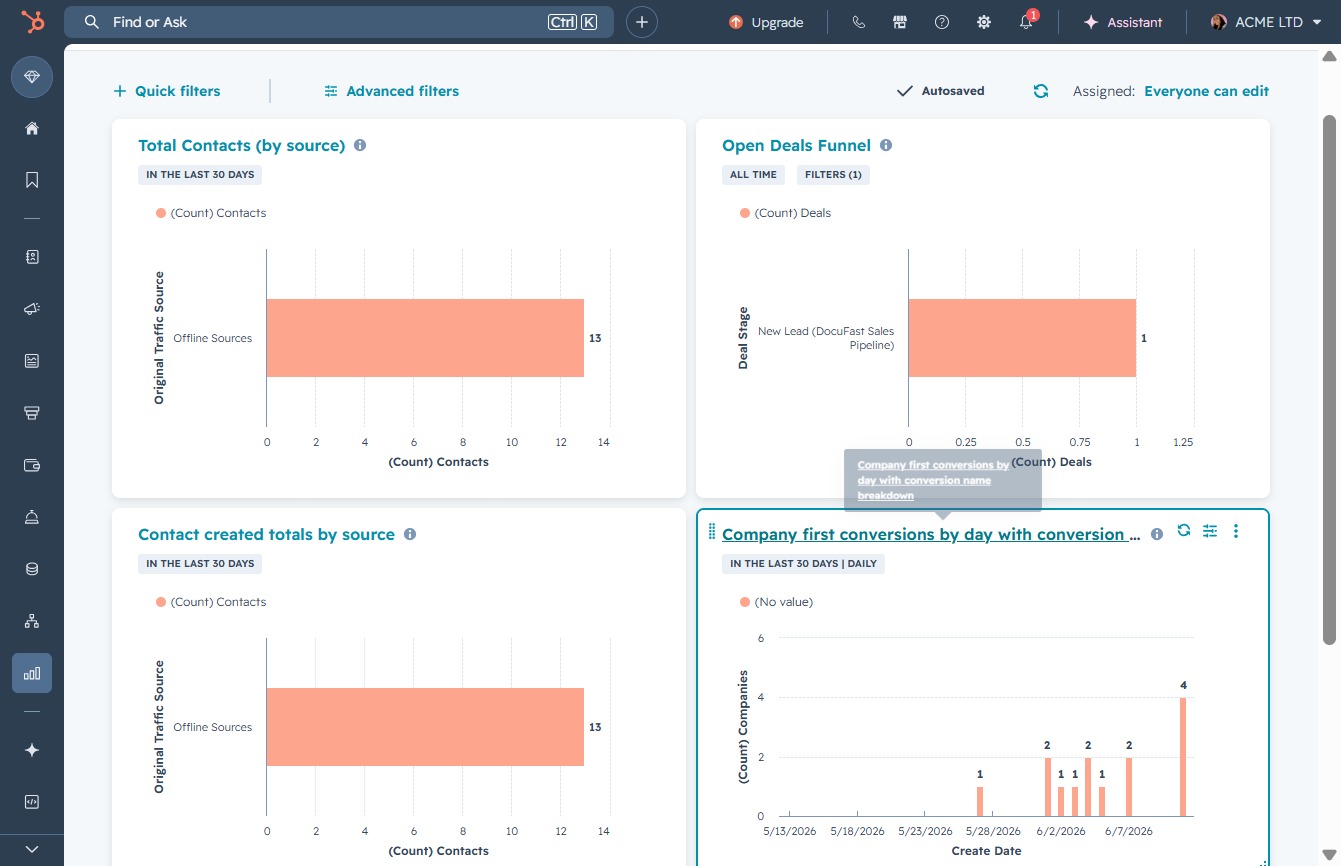
This action will display a detailed breakdown of the company's initial conversions on a daily basis, allowing you to review specific conversion names and associated metrics.
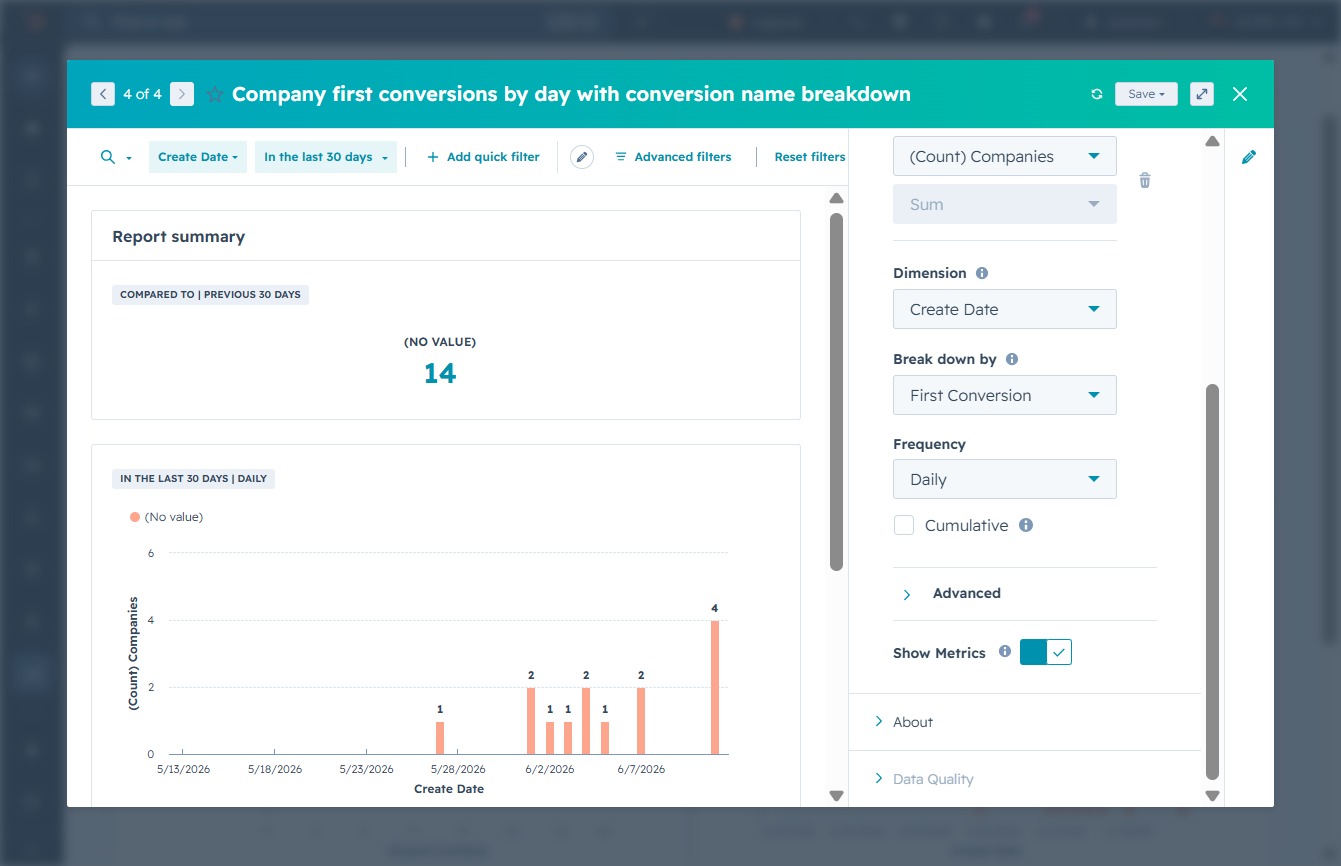
Selecting the 'Daily' frequency will configure the report to display first conversions on a daily basis. This allows for a more granular view of conversion data over time.
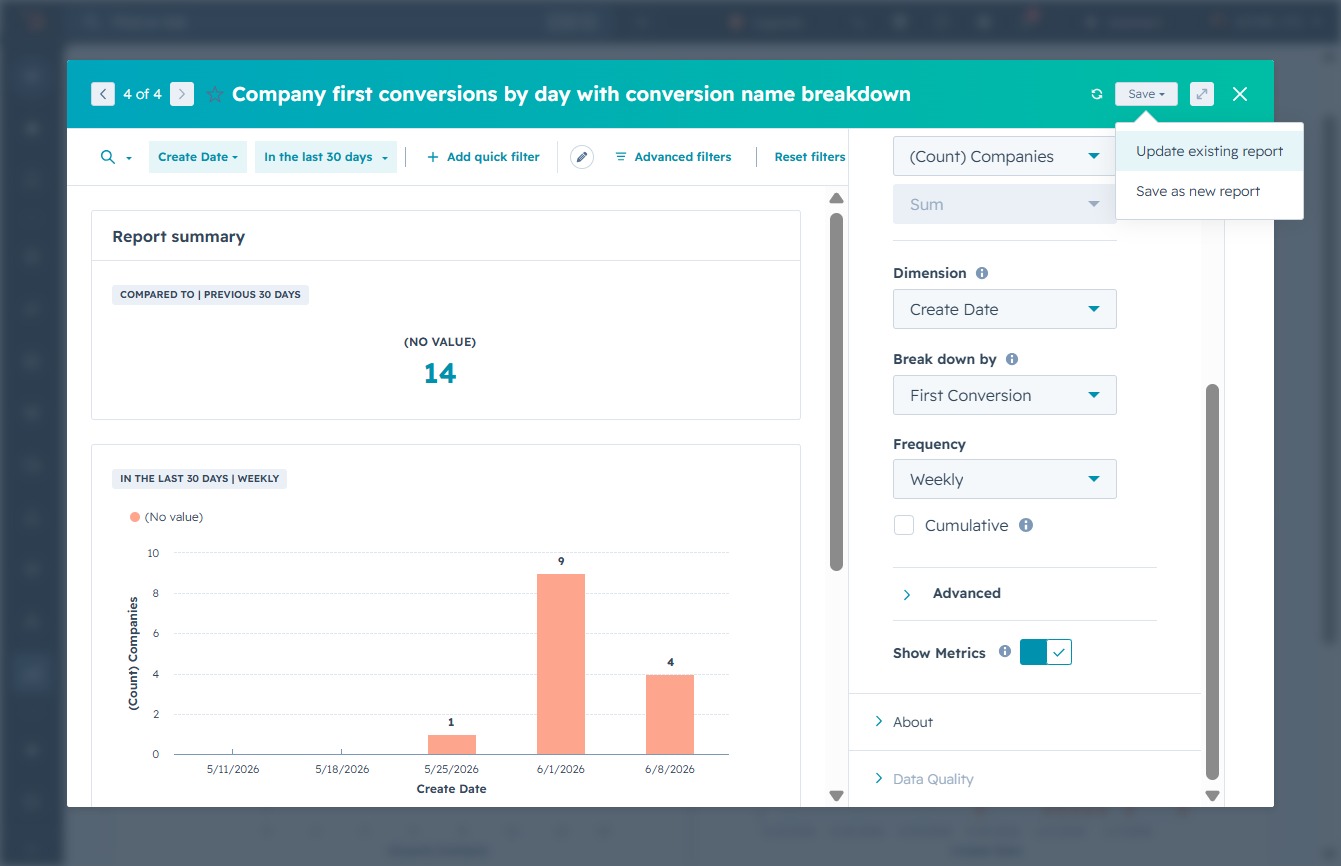
This action sets the frequency of your report to display data on a weekly basis, allowing for a summarized view of conversions per week.

By clicking the Save button, your current report settings will be preserved, ensuring that all filters and configurations are stored for future access.

This action updates the current report with any changes made to the report parameters. You will see the revised data reflected in the report summary and charts.